Event Log Integration Into Enterprise Knowledge Graphs
Connecting event logs to knowledge graphs adds real-time sequence and causality to static models.
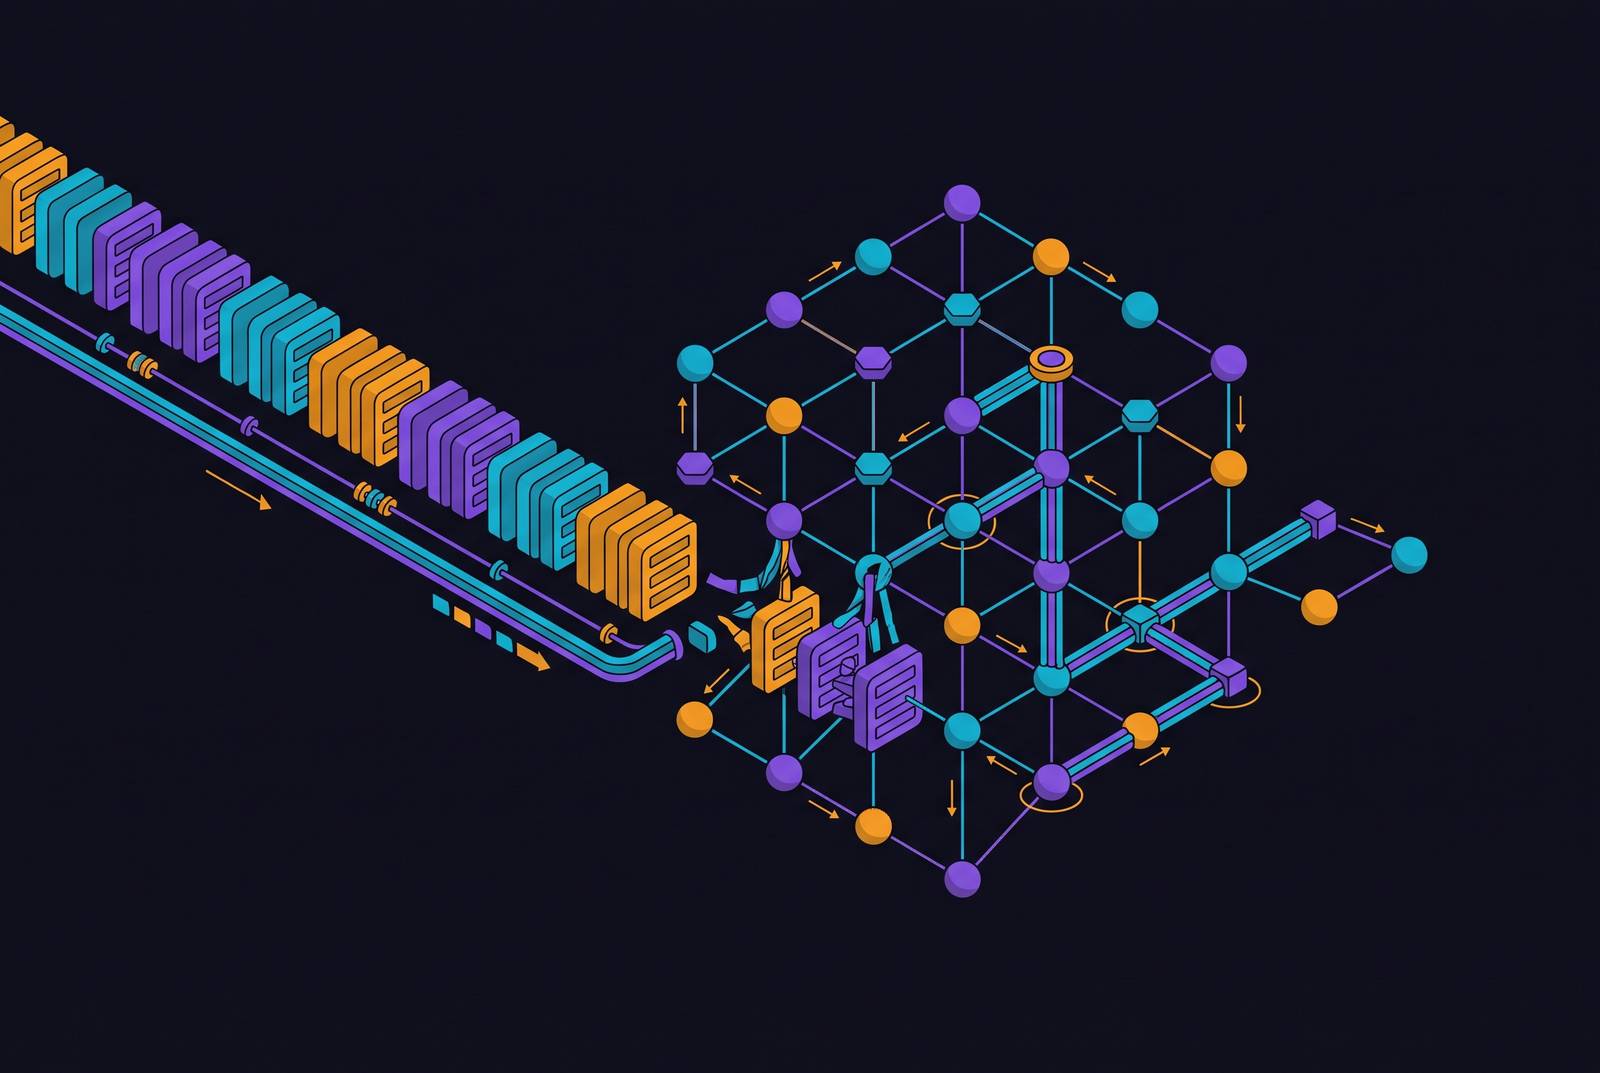
Event logs are the timestamped record of what actually happened inside a company's systems: every order placed, every ticket closed, every login, every sensor ping. Wiring those logs into an enterprise knowledge graph turns a semantic model that describes how a business is structured into one that also knows what's happening right now, and how it got there. That shift, from static structure to live sequence, is the subject of this piece.
Event logs in an enterprise context and why they differ from other data
An event log is a machine-generated record of a discrete thing that happened, stamped with when it happened. ERP systems log inventory moves. CRM platforms log every call and email touch. ITSM tools log ticket opens and closes. Manufacturing lines log sensor readings and machine states. HR platforms log status changes. Network gear logs connection attempts. All of it is the same basic shape: something changed, and the system wrote down when.
What makes these logs different from a normal database table comes down to four things.
Sequence matters first. An event log doesn't just say two things happened, it says which one happened first. That ordering carries meaning a snapshot can't hold, because the same two events mean something different depending on which came before the other.
Causality often sits right in the data, not bolted on after the fact. One event triggers the next, and the chain between them is part of the record itself rather than something an analyst has to infer later.
Then there's the clock. Enterprise logs run on millisecond or second precision, not the daily or weekly batch cycle most reporting tables use. And the volume backs that up: real-time analytics systems built for this kind of data are routinely built to handle 500,000 events, which gives some sense of the scale these systems operate at once a company of any size turns its logging on.
Compare that to a normal structured record, a row in a CRM or an ERP table. Those rows tell you where things stand right now. A customer's status field says "active." An order row says "shipped." Event logs tell you the path that got there. A photograph shows where things stand right now, while a flight recorder shows the path that got there.
Object-centric event logs are a more recent wrinkle. Instead of tying one event to one case, these formats let a single event touch several business objects at once, an order, a customer, and a shipment, all inside one recorded moment. Virtual knowledge graphs have emerged as a key technique for pulling these object-centric logs out of source systems, and that approach has become something of a standard reference point for anyone building this kind of pipeline.
Capabilities and Limitations of a Static Enterprise Knowledge Graph Without Event Log Integration
An enterprise knowledge graph models entities, the relationships between them, and the business definitions that give those relationships meaning. It's not a graph database, which is just a storage engine for graph-shaped data, and it's not a data catalog, which just lists metadata about tables. A knowledge graph is built to reason: it infers, it connects, it answers questions that cut across systems that were never designed to talk to each other.
That inference is the whole point. If the graph knows a VP is a subclass of Executive, and Executive is a subclass of Employee, a query for "all employees" pulls in every VP automatically. Nobody had to write that relationship down by hand. The graph works it out from structure.
Static graphs, done well, are genuinely useful on their own. A few things they handle without any event data at all:
- Entity resolution. The graph recognizes that "John Smith" in Salesforce, "J. Smith" in an ad platform, and "johnsmith47" in a support ticket queue are the same person.
- Shared definitions. Finance calls someone an "active customer" based on billing status. Marketing calls them active based on login frequency. The graph holds both definitions and ties them to the same resolved person.
- Cross-silo traversal. A query that would take five JOINs across five relational tables becomes a native pattern match in the graph, no manual stitching required.
None of that tells you what's happening right now, though. A graph refreshed once a night can call a customer "active" for hours after their contract actually lapsed. It can show that a complaint got filed and later resolved, but it has no way of situating that sequence against external deadlines or clocks that started at some earlier point. It can't say which prior event caused the state it's currently displaying. And if someone asks what the graph actually knew at 9:14 AM on a specific Tuesday, when some agent, human or automated, made a call based on it, a static graph has no answer. It only knows now, and "now" keeps moving.
Architectural Integration of Event Logs into a Knowledge Graph
There are two main ways event data gets into the graph, and most real deployments end up using some mix of both.
Virtual knowledge graphs surface event data through a query layer without physically moving all of it into the graph store. Xiong et al.'s work demonstrated this approach as a practical option. It cuts down on replication cost since data stays where it lives, but it trades that savings for query latency, since every lookup has to reach back to the source system.
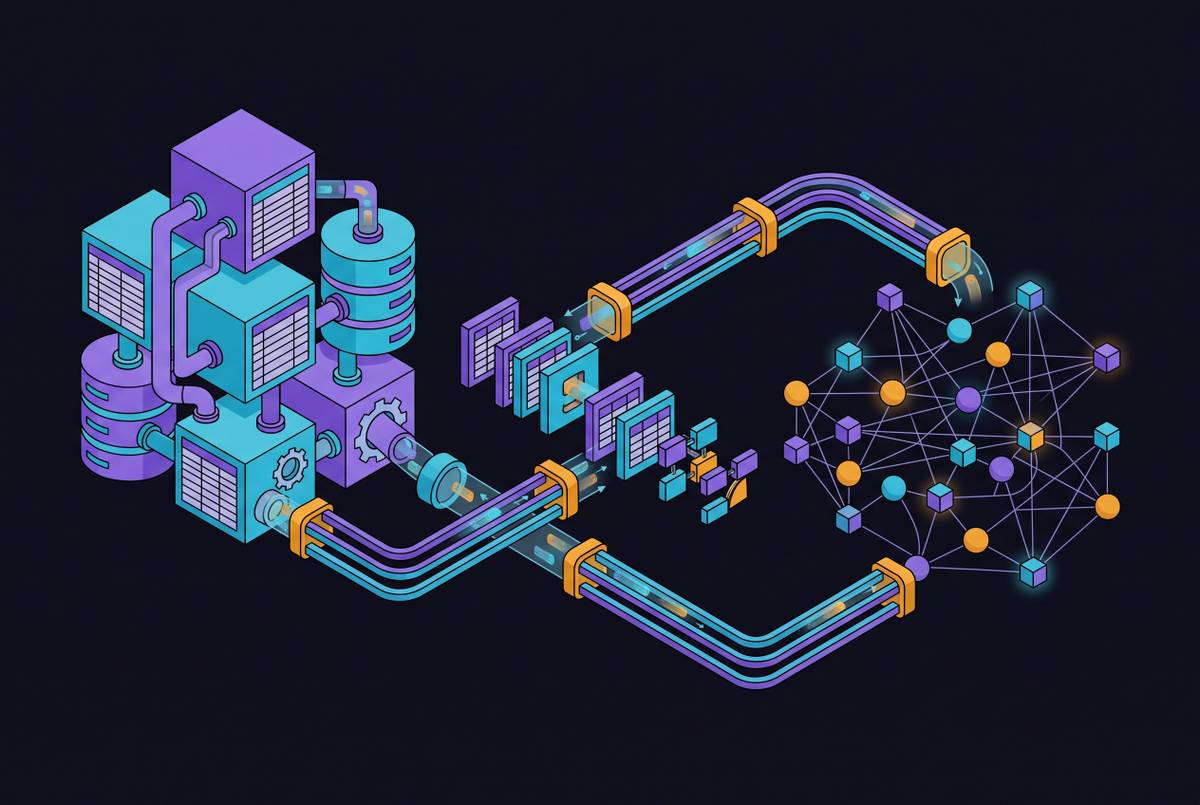
Streaming and change-data-capture (CDC) pipelines take the opposite approach: events get pushed into the graph in near-real time as they happen. Graph platforms built for this kind of load are being developed to handle over 1 million queries per second, which is the scale needed once event data starts flowing continuously rather than in nightly batches.
Either way, raw events don't mean anything to a graph until they're typed and connected to existing entities. That's where an ontology layer comes in. The EVErPREP framework, built around an airline baggage-handling case, pairs a domain-specific ontology with the Simple Event Model Ontology, known as SEM. The domain ontology handles the static concepts, sensor types, airline names, passenger records, while SEM acts as a process metamodel, describing events in terms of who did what, where, and when. Two ontology layers working side by side, one for the nouns, one for the verbs.
Entity resolution has to happen at the moment of ingest, too. An event log entry usually references a case ID or object identifier, and that identifier needs to map onto the right graph entity before the event means anything. When confidence in that match hits around 95%, the merge happens automatically. Below that threshold, it gets flagged for a person to review, because a wrong merge at this stage poisons everything downstream.
Contributions of Sequence and Causality Beyond Structured Records
Order isn't the same thing as a timestamp. Knowing Event B came after Event A is a different fact than just knowing both events happened, because the order changes what each event means in relation to the other. A refund that follows a complaint tells one story. A refund that precedes a complaint tells a completely different one, even though the two entities involved, and the two event types, are identical.
That's the gap causal modeling is built to close. A paper published in the Journal of King Saud University – Computer and Information Sciences walks through a method for building causal knowledge graphs out of enterprise events: product launches, investments, partnership announcements. The system pulls these events out of text, runs them through a classifier trained specifically to spot causal links, and folds the result into a graph meant to support strategic decisions. Under the hood, it combines pre-trained language encoders with graph neural networks, so the model captures both the local context around each event and the broader causal web connecting events across the whole graph. Against ten baseline methods, the approach picked up F1 gains of 3 to 5 percentage points on causal event detection, which is a meaningful jump for this kind of task.
What does a causal edge actually buy you that a plain correlation doesn't? A few concrete things:
It lets the graph predict what happens next from a current event, instead of just fetching similar events from the past.
- It separates a complaint that caused a refund from a refund that happened to precede a complaint, same two entities, opposite direction of accountability.
- It lets someone trace backward from a current state to the upstream action that produced it, turning a correlation query into an actual root-cause query.
Process mining is the discipline that puts a formal name on all this. Organizational mining, applied to raw event data, produces the actual agent structures and process flows running a business, revealed not by the flowchart someone drew three years ago but by what's really happening. Process mining research has begun applying this technique to organizational event data, treating the reconstruction of what happened and when as a foundational challenge for understanding how processes and agents actually behave.
Practical Effects of Event-Log-Enriched Graphs on Decisions and Automated Actions
Knowledge graphs are moving out of the pilot-project phase and into the plumbing that decisions actually run on. That shift means teams need shared definitions, a traceable record of how a decision got made, and reasoning that can survive being pulled apart in an audit or a regulatory review.
Take a regulatory compliance example. A bank routes a customer complaint into a standard queue with a standard internal service-level agreement. Buried in that queue, a subset of complaints actually involve Reg CC funds-availability violations, which come with a tighter regulator notification clock, a much tighter deadline than the SLA the routing model was built around. The routing system treated every complaint the same way. Without event sequence data feeding the graph, there was no way to see that the notification clock had actually started at intake, not at resolution. Without sequence data surfacing that mismatch, the tighter deadline could go unmet before anyone noticed.
An event-enriched graph would have caught the chain before it became a miss: intake event, then regulatory clock start, then SLA assignment, then clock expiry, all visible in sequence, not reconstructed afterward from scattered records.
Cross-silo workflow cases follow the same logic. A person's licensing application, their progress through required steps, and their support ticket history often sit in three different systems that were never built to talk to each other. A static graph can already tell you those three records belong to the same person and the same overall workflow. The graph also knows the order things happened in when event logs are added: application submitted, licensing gap flagged, follow-up email sent, exam scheduled. That sequence is what lets someone tell a stalled case apart from one that's just moving slowly.
On the strategic side, causal event graph frameworks can let a company reason forward from past patterns, tracing which investments tended to precede which product outcomes, or which partnerships lined up with which revenue shifts, and using that causal chain to weigh the likely outcome of a strategy before committing to it.
Decision traceability and the ability to replay what the graph knew at a past decision moment
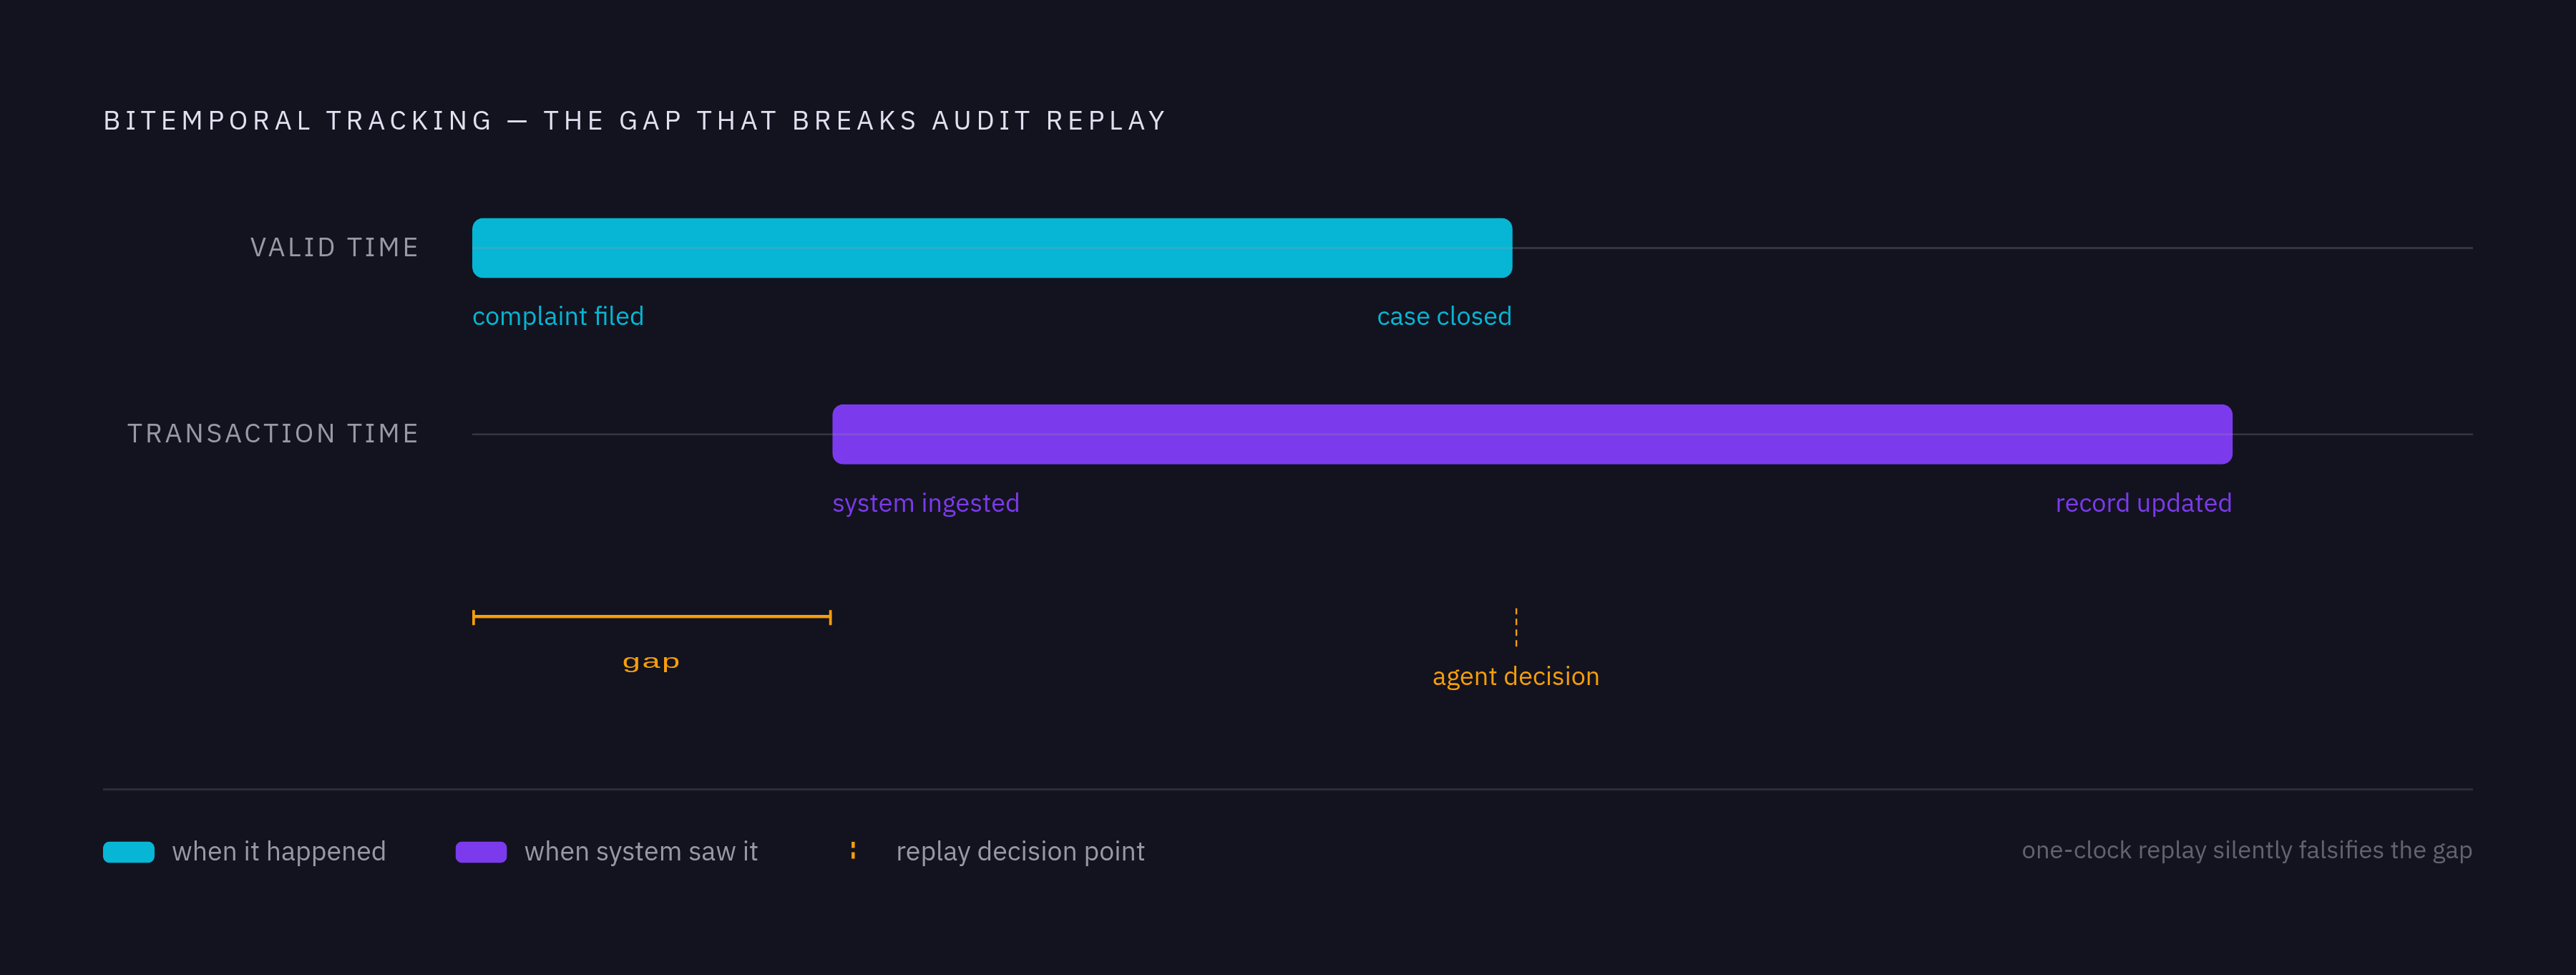
Reconstructing what an automated agent actually saw at the moment it made a call requires more than just timestamps. The graph needs to track two different clocks for every fact: when the event actually happened out in the world (valid time) and when the system recorded that event (transaction time). A 2026 arXiv preprint, "Quipu: A Governed Bitemporal Knowledge Graph Store," builds strict ontology enforcement around exactly this pattern, specifically so that past decision states can be replayed accurately later.
Skip the bitemporal piece, and replay breaks. If event records get overwritten in place rather than tracked across both clocks, the graph you're looking at during an audit doesn't match the graph the agent actually consulted at decision time. What you get back isn't the real decision context, it's a plausible-looking counterfactual standing in for it.
A May 2026 arXiv paper, "Decision Evidence Maturity Model for Agentic AI: A Property-Level Method Specification," lays out a formal scoring method for how complete and trustworthy an agent's evidence trail actually is. Event logs are a natural input to such a framework, because they carry the record of what information existed and when it became available, which is the raw material any evidence-maturity check has to work from.
Putting those pieces together makes a decision fully traceable down to specifics: which entities, which relationships, which rules fed into it. Event logs supply the what-and-when. The graph supplies the what-it-means. Neither one alone reconstructs a decision. Together, they do.
Governance controls that event-enriched graphs make enforceable rather than documented
Most AI governance today lives in a policy document rather than in the systems it's supposed to constrain. Only a small share of companies currently have governance frameworks mature enough to actually hold up under scrutiny, even as many organizations move to deploy agentic AI. Worker access to AI tools has climbed sharply on top of that gap. The systems making decisions are scaling faster than the oversight meant to check them.
An event-enriched graph changes what "governance" can actually mean in practice. A rule written into policy, notify the regulator within 10 days of intake, can only be enforced automatically if the system knows, event by event, exactly when the clock started and what happened at every step after. Without that sequence recorded and tied to specific graph entities, governance stays something written down and hoped for. With it, governance becomes something the graph itself can check, flag, and act on, before the deadline passes rather than after.